
Deployment Vs. Release
Before we delve into the different styles, I want to make a couple of terms clear. Often the ideas of "release" and "deployment" are used interchangeably. But don't be deceived. These are related but different, and some strategies hinge on understanding the difference between them.
Deployment
Deployment is likely the term you understand best. It refers to updating executable code to a specific environment and running it. Strong practices like continuous delivery and continuous deployment focus on how to package this code and get it to the appropriate environment. They often encourage automation and eliminating disruption risks for your customers. Often, as soon as we deploy code customers can see it. However, deploying code need not be the factor that determines whether or not your customers see it. The goal of deployment is to ensure your code can run properly in the appropriate environment.
Release
Releasing is all about making the output of new code visible to your customers. The simplest way to do this is to deploy that code and let it immediately become visible. This is why this concept is often confused with deployment. However, there are many ways to hide code from customers even while it's deployed. The goal of releasing is ensuring a feature meets customer needs and is turned off when defective.
Blue/Green
Blue/green deploys are focused purely on deployment as a way of eliminating downtime and disruption for customers.
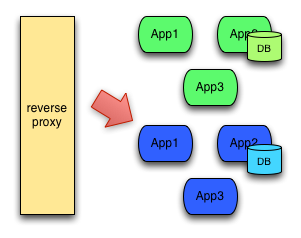
How Does It Work?
Let's say you're writing a blog post (go figure) and your audience is expecting to see something in an hour. But you don't like the post and want to rewrite it from scratch. Well, you're not sure you can finish in time, so you publish the old one. When you do have time, you can rewrite the post completely and publish it after the due date, replacing the older version. Depending on when customers visit the blog, they will either see the old post (and you'll get credit for meeting your deadline), or they'll see the new one and enjoy some quality content. Either way, no one will ever see an empty space where they were expecting a post.
Instead of blog posts, picture running software. When you need to deploy a new software version, instead of replacing the existing version you run the new one side by side with the old one. Once everything looks good, you can switch traffic to the new service. That way, customers are always able to get to your system.
What's It Good For?
Blue/green deployment drastically reduces risk in many situations. If you have a site where it costs significantly to be down, even for a few minutes, this option can save your bacon.
Canary
Canary deployments, also known as canary releasing, are usually release-focused. But, sometimes, they can also be deployment-focused. They are deployment-focused when you use your deployment scripts to only update the code on specific containers or servers. They're release-focused when you can change which canary features are visible to some users without redeploying.
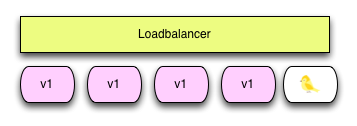
How Does It Work?
Canary releasing can work many ways, but essentially you only release a new version or functionality to a small set of customers to start. You then monitor your system and the customers' responses to see if anything...weird...happens. The odd name for this deployment comes from coal miners lowering canaries into the shafts to detect noxious gases so they can see if it's safe before they descend themselves.
Think of canary releasing like a bottle of pop. You accidentally drop it on the ground. You're not sure if it will start spraying everywhere when you open the bottle, so instead of just turning the cap quickly and risking that the pop will explode, you turn the cap slowly to eke out a little air with every rotation. Eventually you can safely open the bottle and drink a refreshing beverage. Canary releasing is eking that software out to the world, user by user.
What's It Good For?
Canary is fantastic for lowering the risk of changes to production. The "no defects in production" mentality is a little overrated, and canary lets you mitigate the cost of defects without spending an enormous amount on preventive testing. (You should absolutely spend some effort on preventive testing, though.)
A/B Testing
A/B testing is a release strategy. It's focused on experimenting with features.
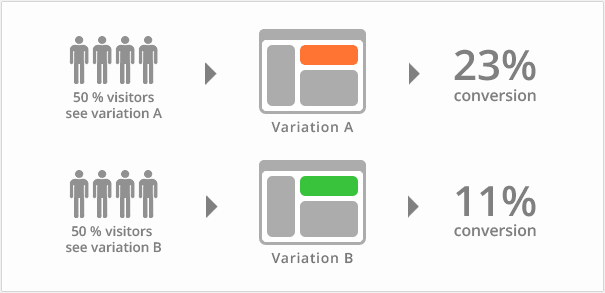
How Does It Work?
With A/B testing, implementation is similar to the process of canary releasing. You have a baseline feature, the "A" feature, and then you deploy or release a "B" feature. You then use monitoring or instrumentation to observe the results of the feature release. Hopefully, this will reveal whether or not you achieved what you wanted.
You're not only limited to two versions in a test. Netflix, for example, has multiple covers it displays as the graphic for the same show based on the version it predicts users will respond to and want to see. But be careful: It's healthy to only run one experiment at a time.
What's It Good For?
A/B testing from the 1,000-foot view may look a lot like canary releasing: You have a set of users seeing the new stuff, and a set with the old stuff. However, A/B has a much different intent. While the focus of canary releasing is risk mitigation, A/B testing's focus is on how useful a feature is for customers. It's the old argument of "build the thing right" vs. "build the right thing."
Working Together
Though these three options all tackle different goals, by no means are they mutually exclusive. You can have a system that's backed by blue/green deploys that set up features you can canary-release by region or customer last name. And you can set up certain key features as A/B experiments with your highest-paying customers. These all can work in harmony.
Get Past the Buzz, Choose a Style
We love throwing out buzzwords in this industry, and it can get confusing fast. This is especially true when these jargon-filled concepts operate similarly on the surface. I hope this article helped clarify the differences between these three deployment strategies. Pick one or more that work for you.